- Research
- Open access
- Published:
Non-isothermal stability by linear heating: a fast method for preformulation stability screening of drugs at the discovery and development interface
AAPS Open volume 3, Article number: 2 (2017)
Abstract
The non-isothermal method for prediction of chemical stability of pharmaceuticals has been discussed in the literature for almost half a century but it has not yet been systematically evaluated. The purpose of this study was to carry out a comprehensive experimental evaluation of the non-isothermal method against the conventional isothermal method for a fast preformulation stability screening. The chemical stabilities of 20 pharmaceutical compounds in aqueous based solution were investigated. Degradation rate constants (k), activation energies (E a), t 90% and t 98% (times for 10 and 2% loss of potency, respectively) were determined by applying the Arrhenius equation to stability data generated by both non-isothermal and isothermal methods. A comparison of the results indicated that the ‘1 week’ non-isothermal experiment is as accurate as the ‘8 weeks’ isothermal experiment for placing compounds (15 out of 16 cases) into the same binning categories based on t 90% and t98% values. The absolute values of k, t 90% and t98% at 25 °C determined by the non-isothermal method for compounds with first order (or pseudo-first order) degradation kinetics were within a factor of two compared to those determined by the isothermal method. The non-isothermal method proved to be not applicable for accurate prediction of the shelf-lives of pharmaceuticals, however, when used to bin discovery compounds based on likely issues related to chemical instability, the non-isothermal method can be carefully implemented as a cost effective, fast, and relatively ‘high-throughput’ method to support drug stability screening at the discovery and development interface.
Background
Non-isothermal stability by linear heating (LNISO) has been explored as an accelerated method for predicting the long-term stabilities and shelf-lives of pharmaceuticals for almost five decades (Yoshioka et al. 1987, 1988; Zoglio et al. 1968). However, this method has never been systematically evaluated across numerous compounds in a single study and compared directly to conventional isothermal stability method. LNISO can be a robust and cost effective method to rapidly (within a week) assess the chemical stabilities of drug candidates at the early stages of development. The experimental efforts and related costs of LNISO testing are minimal (e.g., 1 week experiment with 6 samples of each compound tested for chemical stability at different time points on an hourly timescale). The LNISO method allows for stability screening of a greater number of drug candidates in a short period of time during preformulation at the discovery and development interface.
Various theoretical models have been developed to apply the non-isothermal method by using linear-, exponential-, logarithmic-, reciprocal, and step heating profiles (Zhan et al. 1997a, 1997b; Lin et al. 2009). Yoshioka, et al., evaluated non-isothermal methods by simulated linear heating of drug substances in solution to predict drug stability (Yoshioka et al. 1987, 1988). These studies used a Monte Carlo simulation method and not actual experimental data. A much earlier study by Zoglio, et al. highlighted the usefulness of the LNISO method in stability screening of drugs in different pharmaceutical formulations (Zoglio et al. 1968). However, no comprehensive studies have been conducted to show that stability parameters predicted by the LNISO method are reproducibly in good agreement with the same parameters obtained by the conventional Arrhenius stability method.
As the non-isothermal method may not accurately predict absolute rate constant (k) and activation energy (E a) values (Yoshioka et al. 1987, 1988), the present study was designed to evaluate feasibility of the method for compound binning based on kinetic t90% (time for 10% degradation) and t98% (time for 2% loss of potency) values. Compound binning refers to the categorization of compounds into three groups: those which are highly stable and unlikely to present major challenges when it comes to drug stability (BIN 1), those which may be problematic with respect to chemical stability (BIN 2), or those which are chemically unstable and unlikely to have an adequate shelf-life (BIN 3).
At the discovery and development interface, the use of t90% values to establish binning classifications for stability screening is considered adequate, since it most often represents the outer limit of the stability. However, t98% is more relevant when evaluating degradation in terms of impurity limitations imposed by the ICH guidelines (ICH Guideline Q1A, R2 2003; ICH Guideline Q3A, R2 2006; ICH Guideline Q3B, R2 2006), and can therefore be more applicable for stability screening at later stages of the development.
The LNISO method used in this study was conducted with a focus only on chemical stability of drugs in solution. For chemical stability assessment of drugs in the solid state, an Accelerated Stability Assessment Program or ASAP can be used, which is discussed in detail elsewhere in the literature (Waterman 2011). The ASAP method is based on an isoconversion concept that compensates for the complexity of solid-state degradation reaction kinetics and applies a moisture-corrected Arrhenius equation that explicitly takes into account the effect of relative humidity (RH) on the degradation rates in solid state (Waterman 2011).
Another accelerated stability method presented in literature is single (high) temperature point stability testing (Yoshioka et al. 1990). While very useful, using the ‘single temperature stability’ approach to rank order drug candidates requires an assumption that the activation energies are similar across the comparing group. That is, it assumes that what is seen at a high temperature predicts the relative stability at, for example, controlled room temperature. This method also does not provide any insight into the relative temperature sensitivity of the degradation and thus a possible controlled temperature shelf-life, however defined.
The LNISO method is most effective where degradation pathways follow first order (or pseudo-first order) kinetics and there are no major mechanism changes or changes in rate-determining steps with changing temperature. Complications may also arise when there are multiple pathways to degradation each with very different E a values. Common examples of reactions that may not follow the first order degradation kinetics include certain oxidation reactions, bimolecular reactions and reversible reactions to equilibrium, such as racemization/isomerization. In the LNISO method used in this study, the assumption is made that degradation of compounds follows first order reaction kinetics and that the activation energy is relatively constant over the temperature range studied. The aims of the comprehensive experimental and analytical work presented in this study were as follows:
-
To compare the LNISO method against the conventional isothermal method by using two compendial drugs, acetaminophen and sulfacetamide (Fig. 1), with their known isothermal stability profiles reported in the literature (Koshy and Lach 1961; Meakin et al. 1971).
Fig. 1 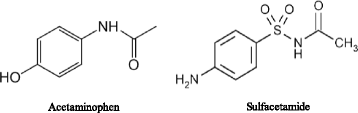
Chemical structures of the model compounds, acetaminophen and sulfacetamide
-
To assess feasibility of the LNISO method for binning drug compounds by comparing the predicted kinetic t90% values at 25 °C with those determined by the conventional isothermal method. Herein, the anticipated binning categories were chosen as BIN 1: t90% > 24 months, BIN 2: t90% = 12 to 24 months and BIN 3: t90% < 12 months, based on early development criteria. One could envision application of tighter criteria (e.g., t98%) in later stage of the drug development.
-
To evaluate the effect of sampling frequency on precision of the stability parameters determined utilizing the LNISO method, as described by Yoshioka et al. in 1987.

To achieve these aims, the current study was conducted in two parts. The first, comprised a short term accelerated non-isothermal stability experiment (1 week in a LNISO oven by linear heating) on two compendial drugs and 18 discovery compounds with different pharmacophores. The second, was a long-term conventional Arrhenius stability experiment (8 weeks in five separate isothermal ovens), conducted in parallel on the same 18 discovery compounds. A subset of the conventional stability data (time 0 to week 4) was selected for evaluation as an abbreviated isothermal method that could be an alternative method for accelerated stability. Stability data from LNISO experiments were compared to those from the conventional isothermal and the abbreviated isothermal experiments. For the compendial compounds (acetaminophen and sulfacetamide), the non-isothermal data were compared to the isothermal stability data for these drugs reported in the literature (Koshy and Lach 1961; Meakin et al. 1971).
Methods
Materials
The two model compounds, acetaminophen (Lot# 10142144, purity 98%) and sulfacetamide (Lot# A05U023, purity 98%), were both manufactured by Johnson Matthey company and obtained from VWR (USA). Buffers used to maintain the pH in the drug solutions were obtained from VWR. The 18 drug substances (Compounds A1, A2, A3, …, and A18) used in this study all were research grade compounds (purity ≥ 98%) provided by Allergan R&D. All of the drug substances and reagents were used as received.
Experimental methods
Sample preparation
A stock solution of each drug compound was prepared in 30 mM phosphate buffer (pH 7.0) and ethanol (80:20, v/v) to target a concentration of 40 ppm for drug substance. All stock solutions were filtered and dispensed, in 1 mL aliquots, into 2 mL glass ampules. The ampules were sealed by using an ampule sealer, no nitrogen or argon headspace was used. For conventional isothermal stability analysis, 6 ampules were placed in the 40 °C oven, 6 ampules were placed in the 60 °C oven, and 6 ampules were placed in the 80 °C oven. Additionally, 3 ampules were placed in the 50 °C oven to be utilized in the 4 week abbreviated isothermal study. For the non-isothermal stability study, 10 ampules were placed in the temperature controlled non-isothermal oven. Any remaining ampules were stored in a freezer, at −20 °C, as the time zero samples. At the desired time-points, the ampules were removed from the ovens and stored in the freezer (−20 °C) for future analysis by HPLC (high performance liquid chromatography). The pH values were measured by a pH-meter (Beckman Coulter equipped with Mettler electrode) before and after experiment and the measurements were done at room temperature. All pH values measured in this study were apparent pH, as ethanol was used as co-solvent for the aqueous based drug solutions. All sample preparation and experimental conditions are summarized in Table 1.
To monitor any possible pH shifts as a result of increased temperature during the non-isothermal studies, the pH was measured at the end of the stability experiment at 95 °C and the pH shift (decrease in pH) was found to be less than 0.2 pH units.
Sample analysis
Before HPLC analysis, stability samples (including the t0 samples) were removed from the freezer and stored at 40 °C for 1–2 h to help re-dissolve any precipitate which may have formed during the storage at −20 °C. The ampules were vortexed, opened, and their contents were transferred to HPLC vials for analysis.
The HPLC method described in the USP monograph was used for acetaminophen (Official US Pharmacopoeia 2011) and an HPLC method reported by Rao et al., 1999 was used for sulfacetamide. A universal HPLC method (Table 2) was developed in-house and used for analysis of the Allergan compounds tested in this study. The detection wavelength was the only parameter of this method that was changed based on the UV absorption spectrum of each compound.
Non-isothermal stability method
To perform the non-isothermal stability experiments, an advanced non-isothermal stability oven was developed, which maintained exposure of samples to heat by applying a linear heating profile with an accuracy of ±0.1 °C from the target temperatures. A heating block (compatible with ampules or HPLC vials) integrated with a PID (proportional integral derivative) controller was used to accurately control the temperature. A computer software program was developed to control sample heating by a linear temperature increase over the time (e.g., 1 week stability).
Samples were heated in the oven with the linear increase in temperature from 50 to 95 °C for 7 days (30 to 100 °C for 7 days for the model compounds). Stability samples were pulled out of the oven at different time points (time scale in hours) and placed in a freezer at −20 °C to prohibit any further degradation before HPLC analysis.
Theoretical model for the Non-isothermal stability
A nonfractional order chemical reaction can be described by the following general equation:
where k is the rate constant for the chemical degradation, t is the time, and f(C) is the function for remaining concentration of the parent over the time, which depends on the order of the reaction. For zero-, first-, and second-order reactions, f(C) is C, ln C and −1/C, respectively. C o is the initial concentration of parent compound at time zero (t0).
Combining Eq. (1) for a first order reaction at non-isothermal temperature, T = T (t), with the Arrhenius equation (Eq. 2):
will yield a differential equation (Eq. 3) in integral form:
The integral Eq. (3) for decay of a drug by first order kinetics under non-isothermal conditions can be then written as the following general Eq. (4): (Yoshioka et al. 1987, 1988; Zhan et al. 1997a)
where k ’ = apparent degradation rate constant at T ’, e.g., k ’ = k 25 for the temperature at 25 °C
R = the universal gas constant (R = 1.987 cal mol−1 K−1), which is equivalent to the Boltzmann constant but expressed in units of energy per temperature increment per mole
C t = concentration of drug at time (t),
C o = initial drug concentration,
dt = time points (variable),
E a = activation energy (in cal mol−1),
T ’ = temperature (in K) for which the rate constant (k ’) is estimated (e.g., 298 K for k 25),
T (t) = temperature (in K) at the time (t).
For this study, the integral Eq. (4) for decay of a drug by first order kinetic under non-isothermal conditions was written as Eq. (5) specifically to include the apparent degradation rate constant at 25 °C (k 25):
The experimental data was fit to the theoretical model in Eq. (5) to solve the rate constant for decay of the drug at 25 °C (k 25) plus the activation energy (E a) by using the analytical concentrations of the drugs at different stability time points (C t), the sampling times (t) and the temperature values, T(t), measured at each sampling time point.
Non-isothermal heating program
Stability samples are heated in the non-isothermal oven by a heating block controlled by the PID controller. The PID controller maintains a linear temperature profile driven by using Eq. (6) for set points with an accuracy of ±0.1 °C from the actual temperature. Equation (6) is used to generate the linear temperature profile, for example the green line presented in Fig. 2:

where α is the heating rate, T(t) is temperature at time (t) and T 0 is the starting temperature at time 0.
Isothermal stability method
Samples were stored for 8 weeks in separate isothermal ovens with temperatures set to 40, 50, 60, and 80 °C. The stability samples were pulled out at different time points (time scale in days) and placed in a −20 °C freezer until the HPLC analysis.
Abbreviated isothermal stability method
The abbreviated isothermal stability was a subset of the conventional isothermal stability method described above. Samples were held separately in the same isothermal ovens at 40, 50, 60, and 80 °C for 4 weeks. The stability parameters predicted by the abbreviated method were compared to the same parameters predicted using the 8 weeks isothermal stability.
Data analysis and curve-fittings
All HPLC chromatograms were processed using the Waters Empower software. Kinetic analysis of the majority of the compounds was performed by using the peak areas of the parent peak. For two compounds (A8 and A17) the peak areas of the degradation products were used.
The Scientist® software by Micromath (Manual for Scientist 3.0 Program 2006) was used for all data analysis, curve fittings, and determination of the 95% confidence intervals and R2 (coefficient of determination) values. The mathematical model of Eq. (5) was programmed in Scientist®. The program uses a least square fit (regression) for the curve fittings to calculate the k 25 and E a values. The R2 values, which indicate goodness-of-fit for fitting experimental data to the theoretical model in Eq. (5), were calculated by the software. In addition, the Scientist® program was used to calculate confidence interval values (95%) for each estimated stability parameter, i.e., k 25 and E a, where the best regression fit was achieved.
Results and discussions
For the model compounds, sulfacetamide and acetaminophen (Fig. 1), a degradation profile was simulated for each drug by the non-isothermal model programmed by using the Scientist® software, where the known k 25 (rate constant at 25 °C) and E a values reported in the literature (Koshy and Lach 1961; Meakin et al. 1971) were utilized. Figure 2 simulates the degradation profile for sulfacetamide (the red curve) by the non-isothermal model upon linear heating (shown by the green line) using a k 25 value of 6.83 × 10⁻⁵ day−1 and an E a value of 22.9 kcal/mol, as reported for the degradation of the drug at pH 7.4 in the literature (Meakin et al. 1971). An estimated degradation of about 16% was predicted for sulfacetamide by the non-isothermal model, assuming exposure to linear heating from 30 °C to 100 °C for 1 week (see Fig. 2). The non-isothermal experiment observations for sulfacetamide by linear heating can be seen in Fig. 3. The data indicated that 89% of the drug remained at the end of the 1 week non-isothermal experiment, which was ~5% less loss than predicted by the non-isothermal simulation using the literature values for k 25 and E a (c.f. Fig. 3 with Fig. 2). This suggests a difference between stability parameters obtained by LNISO method and those reported in the literature. The degradation rate constant (k 25) and activation energy (E a) estimated for sulfacetamide by the non-isothermal method were 2.38 × 10⁻⁵ (±3.12 × 10⁻⁷) day−1 and 25.0 ± 0.4 kcal/mol, respectively. The activation energy (E a) by non-isothermal method was 9.2% (±1.7) higher than the E a reported for sulfacetamide (Table 3), while the kinetic rate constant (k 25) deviated by 2.9 fold (see Table 3). An earlier study by Anderson referenced in the Meakin et al., study (Meakin et al. 1971), reported a value for E a of about 23.9 kcal/mol, quite similar to the value reported here. It should be noted that the literature study of sulfacetamide stability was performed at 120 °C and the only temperature dependency stability study (pH 7.4, data not reported per se) was done at 99.5, 110, 120, 130 and 140 °C, making extrapolation/projection to 25 °C potentially subject to considerable error.

Figure 4 shows the experimental results for the non-isothermal stability study for acetaminophen (drug concentration and temperature vs. time) at pH 3.0. A pH of 3 was chosen so that a quantifiable level of degradation could be observed during the time course of the LNISO experiment (Koshy and Lach 1961). The acetaminophen data was fitted to the theoretical first order Arrhenius kinetics in Eq. (5) for linear heating simulated by Eq. (6) as displayed in Fig. 4. The kinetic rate constant (k 25) and activation energy (E a) determined for acetaminophen by the LNISO method (k 25 = 7.92 · 10−5 day−1 and Ea = 19.5 kcal/mol) also deviated from the same literature parameters obtained by the conventional isothermal method (Koshy and Lach 1961). The activation energy (E a) deviated by 8.3%, while the k 25 value was 4.1 fold less than the k 25 reported for acetaminophen in the literature (Koshy and Lach 1961) (see Table 3). Again, the same explanation/concern raised with the sulfacetamide study could explain the observations with acetaminophen. Specifically, in the acetaminophen stability by Koshy and Lach, stability was performed at three temperatures of 70, 80 and 90 °C and used to extrapolate to 25 °C. Since only three temperatures were studied and no statistics were provided, extrapolation over this temperature range can lead to considerable variation in the projected rate constant especially when one considers that at pH 3 in the Arrhenius plot shown as Fig. 10 in the Koshy and Lach paper, the three data points showed considerable curvature and thus the 95% confidence values for both the Ea values and the projected rate constants at 25 °C are likely quite large. The differences in the Ea values were modest and understandable considering curvature seen in the Arrhenius plot.

Table 3 is a summary of the k 25 and E a values predicted for the model compounds, acetaminophen and sulfacetamide, by LNISO method vs. the same stability parameters determined by conventional isothermal stability in the literature (Koshy and Lach 1961; Meakin et al. 1971). These results verified that the non-isothermal method might not reproduce exactly the same stability parameters obtained by the isothermal method in the literature but the values for E a are comparable while rate constant values differ by a factor of 2–3. Similar disparities were predicted by the Yoshioka MonteCarlo simulation study (Yoshioka et al. 1987, 1988). Other possible explanations for the discrepancy between the literature values and those predicted by the LNISO method might be: 1) differences in experimental conditions such as pH shift upon increase of temperature by the non-isothermal, buffer concentration, temperature control, etc. 2) differences in sensitivity of the analytical tools (Koshy and Lach 1961; Meakin et al. 1971). It is unfortunate that we did not perform our own isothermal study to address any differences but we were unable for logistical reasons to go to perform such a study but as will be seen with the Allergan compounds, similar differences were seen between the two stability testing methods.
In an initial analysis of the LNISO data for the 18 Allergan compounds, three of these compounds (A3, A9 and A18) were quickly excluded from the more complete study. The first of the excluded compounds, A3, was so unstable that even the time-zero sample (stored in the freezer) showed a large degradation peak in the HPLC chromatograms (>20% by peak area). Two other compounds, A9 and A18, were excluded due to significant and persistent precipitation that was discovered after the removal of the stability samples from the freezer. Lower solubility and recrystallization upon storage at −20 °C may possibly explain the precipitation. The presence of precipitated materials in stability samples for these two compounds caused large variations in the measured drug concentrations that made the data analysis difficult. Another set of three compounds (A8, A16, and A17), showed no statistically significant decrease in parent peak, but fortunately, there was only one major degradation product for each compound as indicated by the HPLC chromatograms. The degradation rate constants for these compounds could be determined with a high precision by monitoring growth of the single degradant of each compound. Since the response factors of the degradants were unknown, an assumption was made that the degradants have the same response factors as the parent drugs. The degradants by both methods were identical (same retention time by HPLC). In summary, there were only three (out of the 18) compounds for which the degradation kinetics could not be accurately determined (i.e., A3, A9 and A18).
Figure 5 shows an example of the data fitting results for the LNISO experiments on Compound A7, which is a typical representation of the non-isothermal data with optimum goodness-of-fit to the theoretical model described by Eq. (5), allowing an estimate of k 25 and activation energy (E a) for each compound.

Linear non-isothermal stability results for Compound A7. The red data points are the experimental data, the green line is the fitted curve to Eq. 5, and the yellow data points are the residuals (experimental minus calculated)
Figures 6 and 7 show representative examples of the data processing results for the conventional isothermal experiments. Figure 6 uses the first order kinetic model to fit the experimental drug concentrations vs. time for Compound A7 at four temperatures: 40, 50, 60, and 80 °C. An Arrhenius plot is obtained by plotting natural logarithm of the calculated first order degradation rate constants (ln k) vs. corresponding 1/T values as shown in Fig. 7. The activation energy is determined from the slope of the Arrhenius plot. The degradation rate constant at 25 °C (k 25) is estimated by extrapolating the linear Arrhenius curve to a temperature of 25 °C.

Isothermal stability results for Compound A7 at 40, 50, 60, and 80 °C. The solid lines are fitted curves using an exponential equation for first order kinetics

Arrhenius plot for Compound A7 based on the isothermal stability results showed in Fig. 6
Table 4 summarizes the calculated degradation rate constants at 25 °C (k 25) and activation energies (E a) by using the 3 methods: non-isothermal method, conventional isothermal method, and abbreviated isothermal method.
There were five compounds (A1, A2, A5, A6 and A10) that had no significant degradation in both non-isothermal experiments and isothermal experiments at 40, 50 and 60 °C (four of the five compounds showed only minor degradation at 80 °C but even this one-temperature point could not be used to estimate a k 25 value). These five compounds were considered stable and classified as BIN 1 (t90% > 24 months).
In summary, there were 10 compounds (out of 15 compounds with usable kinetic stability data) for which k 25 and E a values were determined by all three methods for further binning classifications, out of which two compounds (A11 and A16) did not follow first order kinetics.
Examining the stability data in Table 4 and ignoring the two compounds that did not follow the first-order degradation kinetics (A11 and A16), the k 25 values determined by the LNISO method (11 data points) had an average difference of ±43% compared to those determined by the isothermal method. The E a values predicted by the LNISO method had an average difference of ±3.9% compared to those determined by the isothermal method. These results were better than the previous data on the model compounds, acetaminophen and sulfacetamide, possibly because there was better consistency in experimental conditions, such as pH and buffer concentration, analytical methods and extrapolations.
Figure 8 correlates the k 25 values by the LNISO method to the k 25 values by the conventional isothermal method. The data depicts two outliers (Compounds A11 and A16) within the total of 10 compounds with predictable rate constant values. When the two outliers were excluded, the correlation between the k 25 values by LNISO and isothermal methods was shown to be very good with an R2 value of 0.99. When the two outliers were carefully examined, the stability results of these two compounds had the following two common characteristics: 1) degradation kinetics from the isothermal experiments did not follow first order kinetics; 2) the non-isothermal degradations showed poor model fitting results (R2 < 0.999) causing the large errors in k 25 values as shown in Fig. 8. A more detailed analysis of the errors due to a poor fitting follows.

A correlation between estimated degradation rate constants (k 25) by non-isothermal method vs. conventional isothermal method. The error bars associated with k 25 by non-isothermal method are based on the 95% confidence intervals. The two outliers (Compounds A11 and A16) both showed chemical degradation that does not follow first order kinetics
As an example, Fig. 9 is a plot demonstrating the isothermal experimental results for one of these outliers, Compound A11. The kinetic curves of the drug degradations did not fit first order kinetics. Instead, the data appeared to be biphasic with a fast initial degradation phase in the beginning of the stability experiment (up to 7 days) followed by a slower degradation phase after 7 days.

Isothermal stability results for Compound A11 at three different temperatures (40, 50, and 60 °C). The solid lines are the fitted curves using an exponential equation for first order kinetics
Figure 10 shows the data fitting results for the LNISO experiments on Compound A11. A poor fit can be observed especially at the early time points (up to 72 h). The two common behaviors of the outliers (described above) are dependent on each other: the poor fitting to LNISO experiments is most likely caused by the non-first order kinetics of the drug degradations under isothermal conditions, because processing of the LNISO data (Fig. 10) is performed under the assumption that degradation of the drug follows first order kinetics.

LNISO stability results for Compound A11. The red data points are experimental data, the green line is the fit to Eq. 5
Figure 11 correlates the activation energies (E a) by the non-isothermal method to the same (E a) by a conventional isothermal method. The same two outliers (Compounds A11 and A16) in Fig. 8 are labeled with red color in Fig. 11. By excluding the two outliers, tentatively, the correlation between the E a values by LNISO and isothermal methods was fair with an R-square of 0.95. The two outliers had significantly larger errors compared to the other compounds. The reason appears to be due to the non-first order degradation kinetics (as shown in Fig. 9), which caused a poor fitting of the non-isothermal data to the theoretical model and consequently resulted in a large error in Ea. Although one of the two outliers lies on the correlation line in Fig. 11, it is considered to be a fortuitous result. A more detailed analysis of the errors due to the poor fitting follows.

Comparison of activation energies (Ea) by LNISO method vs. conventional isothermal method. The error bars associated with the Ea values by the LNISO method are based on the 95% confidence intervals. The two compounds displayed in red (A11 and A16) showed chemical degradation that does not follow first order kinetics
Considering the precision of the key stability parameters obtained by the non-isothermal method, Table 5 compares the k 25 and E a values with 95% confidence intervals predicted by using 11 data points versus 6 data points. The data in Table 5 also suggests that the standard errors for k 25 and E a by LNISO method are significantly lower when more frequent sampling (larger amount of data points) are used. The increasing precision with increasing sampling frequency is consistent with the evidence in the literature reported by Yoshioka et al. (1987, 1988). Notably, in Table 5, Compounds A11 and A16 can be considered outliers as the R2 values for both compounds are less than 0.999 indicating a significant deviation from the first-order kinetics.
Regarding accuracy of the key stability parameters, since the conventional isothermal method follows compendial conditions (i.e., pharmacopeia) and requires long time incubations (e.g., 2 months) at constant temperatures, this method is considered as the most accurate method among those studied. By comparing the k 25 values determined by the three methods, the 4 weeks abbreviated isothermal values are the closest to the k 25 values obtained by the 8 weeks conventional isothermal stability with an average deviation of ± 24%. However, the k 25 values determined by the LNISO methods (six data points vs. 11 data points) demonstrated similar deviations from the results by the conventional isothermal method. The average deviations were ± 44% by the LNISO method (6 data points) versus ±43% by the LNISO method (11 data points). For the above analysis, the two outlier compounds (A11 and A16) were excluded.
As can be seen from Table 6, at least a minimum of two compounds were binned into each of the proposed binning categories. The binning classifications by all three methods were in good agreement for all compounds with stability data that followed first order degradation kinetics. All three of the stability screening methods binned nine of the 18 compounds (A1, A2, A5, A6, A8, A10, A14, A15, and A17) into BIN 1, which is the category for compounds with predicted t90% values greater than 24 months. For five of the BIN 1 compounds (A1, A2, A5, A6, and A10) no degradation was observed under the experimental conditions tested. Furthermore, all three methods binned Compound A13 into BIN 2, which is the category for compounds with predicted t90% values between 12 and 24 months. For Compound A7, the non-isothermal method predicted a t90% value of 9.3 months (BIN 3), while the conventional and abbreviated isothermal methods predicted t 90% values of 12.2 and 13.1 months (BIN 2), respectively. Considering that the average difference in k 25 values determined by LNISO method (relative to conventional isothermal) is ±43% (Table 5), for the compounds with predicted t90% values falling within the boundaries of two binning classifications (e.g., cases similar to Compound A7) the compound could be classified either way. Finally, all three of the stability screening methods binned Compounds A4 and A12 into BIN 3, which is the category for compounds with predicted t90% values less than 12 months.
Table 7 was generated for binning classifications of the 18 discovery compounds based on their predicted t98% values into two categories: stable (t98% ≥ 24 months) and unstable (t98% < 24 months). Based on the t98% criteria, 8 compounds (A1, A2, A5, A6, A8, A10, A15 and A17) out of 15 compounds with usable stability data were classified as stable by both isothermal and non-isothermal stability methods and 6 compounds (A4, A7, A11, A12, A13 and A16) out of the 15 compounds were binned as unstable by the two methods. Only one compound (A14) was binned as unstable (t98% =15.3 months) by the non-isothermal method, while predicted to be stable (t98% = 24.6 – 25.6 months) by conventional- and abbreviated isothermal method.
Considering mechanism of degradation for the compounds tested in this study, the model compounds (acetaminophen and sulfacetamide) both degrade by hydrolysis of an acetamide group as described in the literature (Koshy and Lach 1961; Meakin et al. 1971). The amine in the aniline group of sulfacetamide is reported to be also subject to oxidation in the presence of heat and light (Meakin et al. 1971).
The 18 Allergan discovery compounds contain a variety of chemical moieties. Table 8 is a summary of possible degradation sites for those chemical moieties. Overall, the 18 discovery compounds tested in this study can be categorized as the following with respect to the mechanism of degradation:
-
1)
Five compounds (A1, A2, A5, A6, and A10) that didn’t show significant degradations at conditions examined in this study contained functional groups that may be susceptible to hydrolysis, oxidation, or epimerization at different test conditions.
-
2)
Six compounds (A7, A8, A12, A13, A14, and A15) contained amide, sulfonamide, or urea groups, which were prone to hydrolysis, and all degraded by following the first order kinetics. Compounds (A9 and A18) which precipitated during storage and resulted in unusable stability data could possibly be subject to hydrolysis.
-
3)
Two compounds (A3 and A17) contained benzylic carbon bridges sensitive to oxidation.
-
4)
One compound (A11) contained functional groups susceptible to hydrolysis or sulfa-oxidation and demonstrated biphasic, non-first order degradation.
-
5)
One compound (A4) contained chemical groups susceptible to halide displacement, or possible oxidation of hydroxyl group.
-
6)
One compound (A16) with unknown degradation path that didn’t follow first order kinetics.
In summary, there are a few experimental considerations that need to be highlighted regarding use of the non-isothermal methodology for preformulation stability screening at the early stages of drug development. As described here, the theoretical model used for the non-isothermal stability is derived assuming first order kinetics. For this reason, the LNISO predictions are most valid for compounds whose degradation follows such kinetics. When applied to compounds with known, or unknown, degradation pathways, the R2 (Coefficient of Determination) values can be utilized to determine the reliability of the predicted stability parameters obtained by fitting experimental data to the theoretical model for non-isothermal stability. In this study, the results with R2 values higher than 0.999 were considered reliable. In addition, other factors to consider for the experimental design of LNISO stability studies include pH and catalytic buffer effects, both of which could significantly affect the degradation rate constants. For example, compounds that are predicted to be unstable at pH 7, could have significantly greater stability at, for example, pH 5. The results of this study also suggest that the LNISO stability method can be utilized for liquid formulation screenings, where the relative stability of a lead drug candidate can be tested in different solution media for liquid formulations.
Conclusions
The LNISO method is found to be a powerful high-throughput technique for rapid preformulation stability screening of pharmaceutical compounds by binning the compounds into categories based on the predicted t90% or t98% values to discern the most stable compound at the tested condition(s). The LNISO method may not yield k 25 and E a values that exactly match the isothermal values, however, the results of this study shows that these stability parameters correlate very well by the two methods when the same experimental conditions are applied. The good correlations between k 25 (Fig. 8) and E a (Fig. 11) determined by non-isothermal vs. isothermal and the comparable binning classification results by the two methods (Tables 6 and 7) indicate that the LNISO method is feasible for compound binning. The LNISO method should be used judiciously, keeping in mind that the method cannot predict the absolute stability parameters as accurately as the conventional isothermal stability, and it is most effective for compounds whose degradation pathways follow first order (or pseudo first order) kinetics.
References
ICH Guideline Q1A, R2 (2003) Stability Testing of New Drug Substances and Products
ICH Guideline Q3A, R2 (2006) Impurities in New Drug Substances
ICH Guideline Q3B, R2 (2006) Impurities in New Drug Products
Koshy KT, Lach JL (1961) Stability of Aqueous Solutions of N-Acetyl-p-aminophenol. J Pharm Sci 50:113–8
Lin B, Zhan XC, Tao JL, Li LL, Qi HJ (2009) Step Non-isothermal Method to Study Stability of Drugs. Drug Dev Ind Pharm 35(2):154–64
Manual for Scientist 3.0 Program (2006) Micromath Scientific Software V1., pp 51–8
Meakin BJ, Tansey IP, Davies DJG (1971) The effect of Heat, pH and some Buffer Materials on the Hydrolytic Degradation of Sulfacetamide in Aqueous Solution. J Pharm Pharmacol 23:252–61
Official US Pharmacopoeia (2011) Monograph for Acetaminophen. USP 34:1720–1
Rao RM, Rao YM, Shah AH (1999) A reverse phase ion-pairing HPLC method for the stability monitoring of sulfacetamide ophthalmic preparations. J Pharm Biomedical Analysis 20:717–22
Waterman KC (2011) The Application of the Accelerated Stability Assessment Program (ASAP) to Quality by Design (QbD) for Drug Product Stability. AAPS Pharm Sci Tech 12(3):932–7
Yoshioka S, Aso Y, Uchiyama M (1987) Statistical Evaluation of Non-isothermal Prediction of Drug Stability I. J Pharm Sci 76(10):794–8
Yoshioka S, Aso Y, Uchiyama M (1988) Statistical Evaluation of Non-isothermal Prediction of Drug Stability II: Experimental Design for Practical Drug Products. Int J Pharm 46:121–32
Yoshioka S, Aso Y, Takeda Y (1990) Statistical evaluation of accelerated stability data obtained at a single temperature. I. Effect of experimental errors in evaluation of stability data obtained. Chem. Pharm. Bull (Tokyo) 38(6):1760–2
Zhan X, Yin G, Wang L, Ma B (1997a) Exponential Heating in Drug Stability Experiment and Statistical Evaluation of Non-isothermal and Isothermal Prediction. J Pharm Sci 86(6):709–15
Zhan X, Yin G, Ma B (1997b) Determination of Rate Order for Degradation of Drugs with Non-isothermal Stability Experiment. J Pharm Sci 86(10):1099–104
Zoglio M, Windheuser J, Vatti R, Maulding H, Kornblum S, Jacobs A, Hamot H (1968) Linear Non-isothermal Stability Studies. J Pharm Sci 57(12):2080–5
Acknowledgement
The authors would like to acknowledge Dr. Scott Smith for his valuable input, scientific discussions and technical guidance regarding use of the non-isothermal method for stability screening of drug substances. The authors wish to thank fellow peers at Allergan, Dr. Patrick Hughes, Dr. Richard Graham and Dr. James Cunningham, for their valuable feedback on this work. Technical support by Mr. Prem Mohanty in preparation of the stability samples, and technical discussions with Dr. Ke Wu are acknowledged. The authors also wish to thank Dr. Sesha Neervannan, Head of the Allergan Pharmaceutical Development, Mr. Lorenz Siddiqi and Allergan Medical Affairs Publications Team for review and approval of this manuscript for publication at AAPS Open.
Funding
The research resources and materials used for the studies presented in this manuscript were funded by Allergan R&D. The manuscript was approved by Allergan Medical Affairs Publications for submission to the AAPS Open journal on January 3, 2017.
Authors’ contributions
The authors are AK, (Scientist, former employee of Allergan), SF. (Sr. Scientist at Allergan Early Development), TK. (Associate Director at Allergan Early Development) and VS. (Distinguished Professor Emeritus at Pharmaceutical Chemistry, The University of Kansas and Academic Consultant of Allergan). The authors’ contributions are the following: AK, SF and TK contributed to the experimental design, laboratory work, data analysis, theoretical interpretation of the results, literature search, review and presentation of Arrhenius theory applied to the non-isothermal stability. Prof. VS had valuable intellectual contributions to the design of the studies, interpretation of the results, literature review and review of the experimental and theoretical sections presented in the manuscript. All authors have equally contributed to the writing of the manuscript. All authors read and approved the final manuscript.
Competing interests
The authors declare that they have no competing interests.
Publisher’s Note
Springer Nature remains neutral with regard to jurisdictional claims in published maps and institutional affiliations.
Author information
Authors and Affiliations
Corresponding author
Rights and permissions
Open Access This article is distributed under the terms of the Creative Commons Attribution 4.0 International License (http://creativecommons.org/licenses/by/4.0/), which permits unrestricted use, distribution, and reproduction in any medium, provided you give appropriate credit to the original author(s) and the source, provide a link to the Creative Commons license, and indicate if changes were made.
About this article

Cite this article
Kairer, A., Feng, S., Stella, V.J. et al. Non-isothermal stability by linear heating: a fast method for preformulation stability screening of drugs at the discovery and development interface. AAPS Open 3, 2 (2017). https://doi.org/10.1186/s41120-017-0012-y
Received:
Accepted:
Published:
DOI: https://doi.org/10.1186/s41120-017-0012-y